Getting started
First you can import some modules like:
import pywt
import numpy as np

import statsWaveletFilt.filtration as fil
import statsWaveletFilt.signals as sig
import statsWaveletFilt.miscellaneous as misc
And follow some steps to make your filtrations:
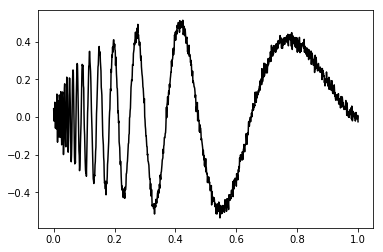
First step: Signal modelling
In many test for filtration and/or estimation of error, showed in articles, are supose an known ideal signal, how show the code above:
import matplotlib.pyplot as plt

dimension = 1024

t, idealSignal = sig.dopplerFunction(dimension)
plt.plot(t, idealSignal, 'k-')
plt.show()

This package also gives a support for anothers three ideal signal: the heavsine (sig.heavsineFunction()), bump (sig.bumpFunction()) and block (sig.blockFunction()).
And add to this a kind of noise, generally gaussian or, also called, normal.
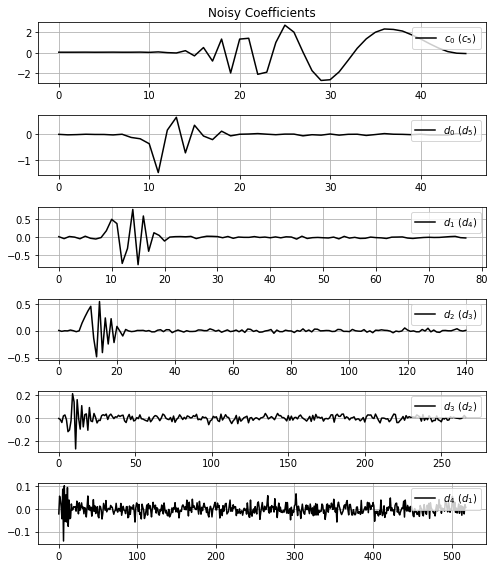
Second step: Wavelet transformation
Let’s do this using the pywt.wavedec function. With this you can 1) make a wavelet transform of your noisy signal, 2) choice wich wavelet function is used ('haar', 'db', 'gaus', 'mexh' among others) and 3) choice any levels you want to evaluate the transform.
The first position = noiseCoeff[0] has the scale coefficents of the last nível. The consecutive elements `` = noiseCoeff[1:]`` has the wavelet coefficients of the last to the first level of transform.
Using misc.showWaveletCoeff function you can show all coefficients returned of the transform.
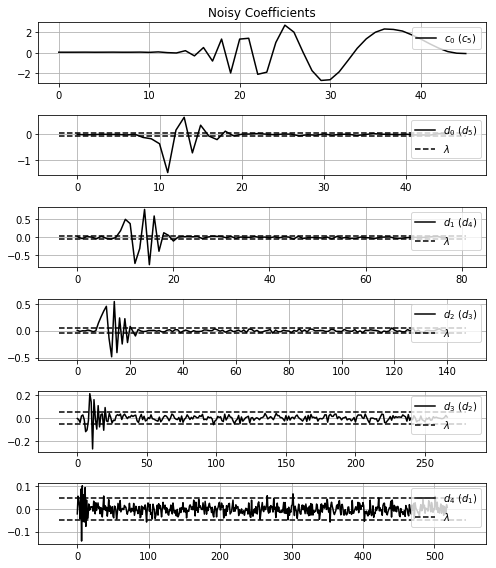
Thirth step: Filtration
With the fil.filtration function you can put yours 1) coefficients for filtration, 2) choice the method ('visu', 'sure', 'bayes', 'spc') and, if necessary, 3) set method own parameters (more details in documentation).
And, again, you can show the wavelet coefficients before and after the filtration, with the limiar used using the misc.showWaveletCoeff function.

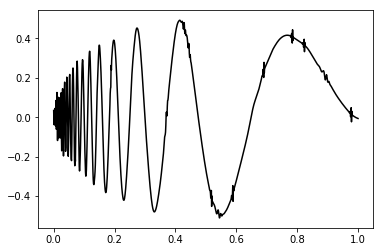
Fourth step: Recovery wavelet transformation
Using the pywt.waverec function we can revovery the signal.
Fifth step: Figures of merith
Using sig.differential_snr_dB we can avaliate the filtration using some figures of merith of different forms of evaluate the snr or cnr (see more in Documentation) of the signal.
sig.differential_snr_dB(noisySignal, filtratedSignal, method=’variances’, idealSignal=idealSignal)
Appendix: Miscelaneous
- The misc.generateData function generate data using the signals showed here with different variances of noise and save in format .npy.
- The misc.normalizeData function normalize a data between a min and max value, this function is used in all signals modeled in sig module.